For my first blog post in well over a year, I chose to take a further look at the NYPD’s publicly available Shooting Incident Data. The link to the public dataset used for this blog post can be found here. As always, all the code that I have written to create the visualizations below will be available to view on my Github.
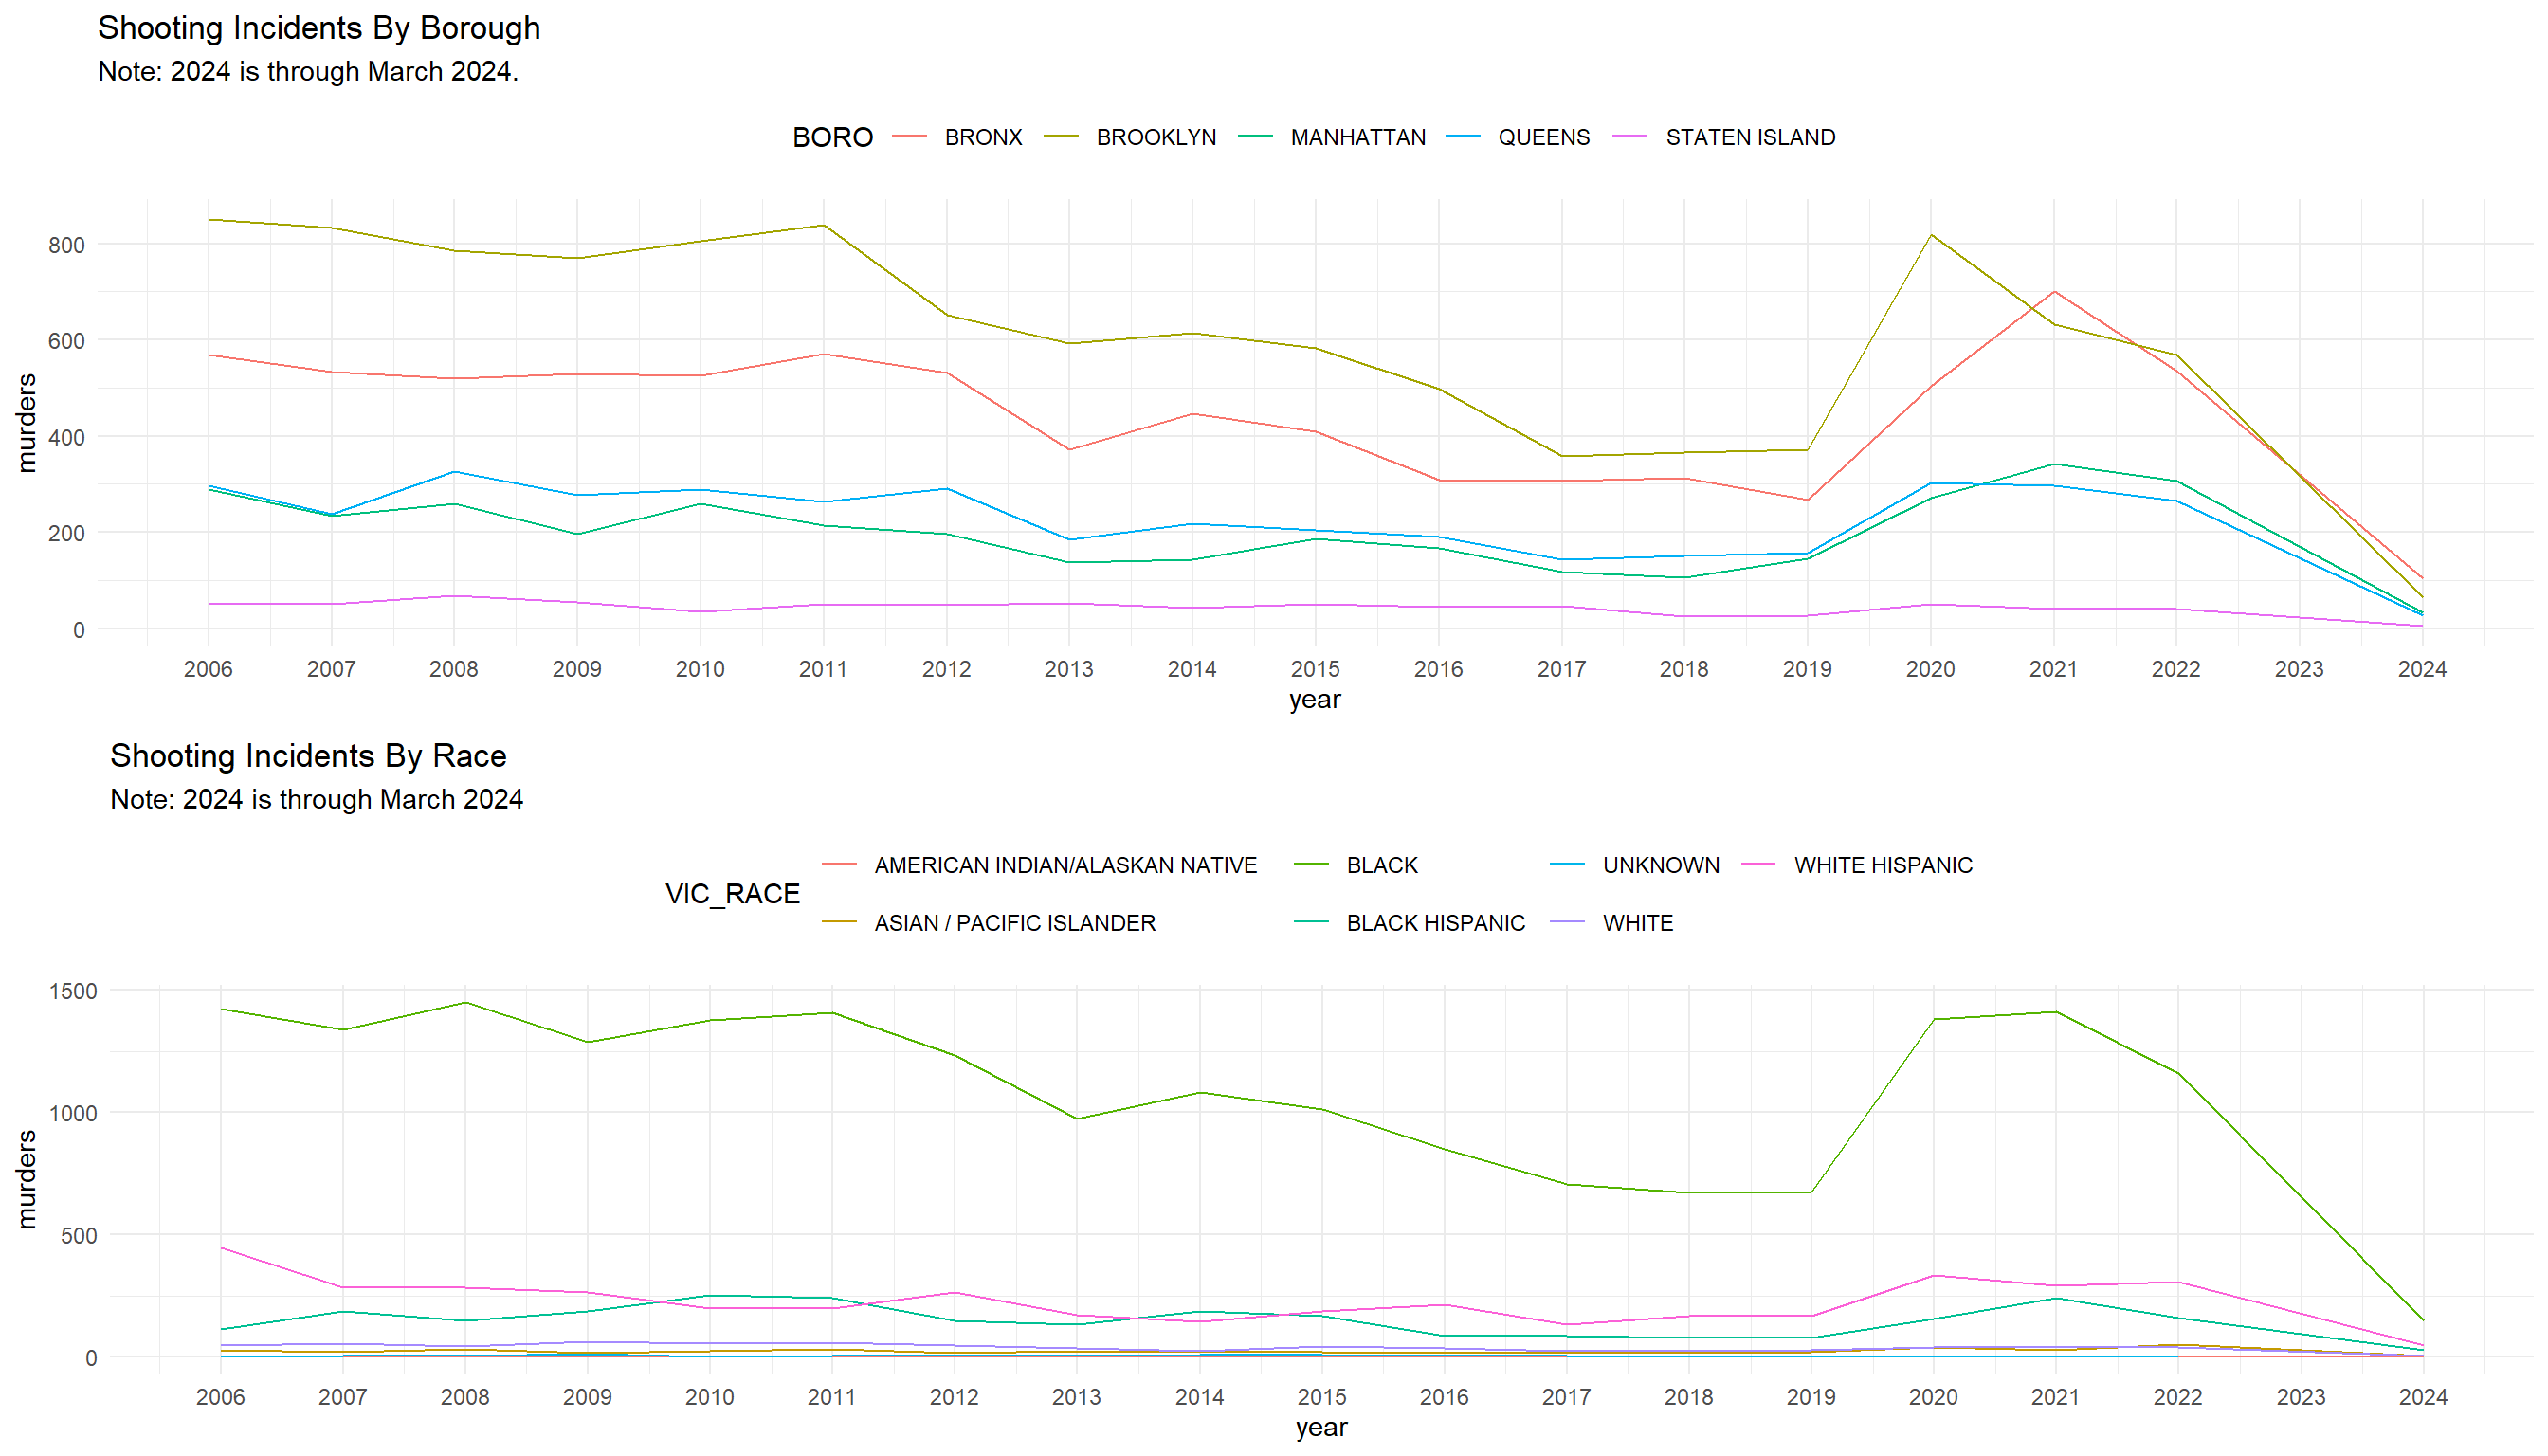
The visualization below is a trended look at the number of Shootings by year. I’ve broken it out by borough as well as the race of the shooting victim. We can see a majority of recorded shooting incidents occur in The Bronx and Brooklyn with African Americans being the primary victim. What really stood out to me was the massive spike between 2019-2020. I decided to focus the rest of this blog in doing further investigations on when these shootings were occurring and where in the boroughs were shooting incidents concentrated.
## `summarise()` has grouped output by 'BORO'. You can override using the
## `.groups` argument.
## `summarise()` has grouped output by 'VIC_RACE'. You can override using the
## `.groups` argument.
To visualize the time when shootings were occurring in NYC by borough, I created a heatmap in ggplot. In most boroughs, shootings occur primarily in the evening/night and rarely during the day. This pattern can be seen in Brooklyn where there were 355 reported shootings in 2020 that occurred between 9pm and 1am.
## `summarise()` has grouped output by 'BORO'. You can override using the
## `.groups` argument.
Finally, I mapped the location of each shooting in NYC in 2020. Using the included geographical coordinates provided in the Data, I used the Leaflet Package in R to create a map of shooting incidents. The NYPD flags shootings if they were counted as a murder. When you click a shooting incident, a user would be able to view the incident date and demographics on the victim.
Location of NYC Shooting Incidents in 2020